
GOALS OF THE SYSTEM
Our RSS Based Automated Radio Telemetry System, developed for automated data collection, is particularly suitable for tracking and monitoring insects, small mammals and territorial bird species. The system’s special feature is that it allows continuous, remote monitoring of several individuals simultaneously.
The system is composed of transmitters, receivers and a central data acquisition and processing unit. The transmitters can be programmed to meet individual requirements, have extremely low weight (0.16 g per battery!) and size, high performance and long life. Each receiver unit simultaneously receives the signals from the transmitters without loss of data and transfers the signals from the transmitters to the central unit where the data is stored and further processed. All data and system status information is available online on a remote computer. The post-processing of the data makes it possible to estimate the habitat use of the observed individuals, their activity for a given time of day, period, season, movement pattern, current position, change in movement pattern or to investigate any correlation relevant to the research.
THE BENEFITS OF THE SYSTEM
GPS vs ARS
The smallest GPS tags weigh around 1 g, so there are some species of animals that cannot be tracked at all. Our system is compatible with transmitters weighing as little as 0.16 g, meaning that they can be attached even to larger butterflies or insects.
Small GPS tags cannot transmit the measured positions, so in order to detect to read the data, you need to recapture the tagged animals. Our radio tags transmit the signals in real-time, and they can be viewed from home on a computer and can be accessed and displayed at any time.
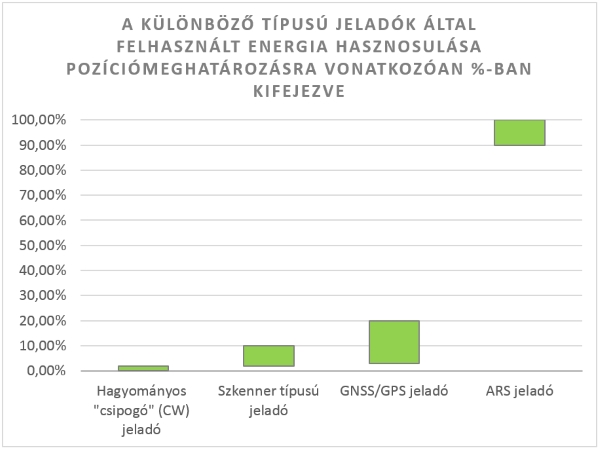
A GPS transmitter has to transmit a given number of attempts to contact the GPS receiver and to transmit data, i.e. to extract data from it. Therefore, if one of the observed animals is underground or under a bush and cannot come in contact with the receiver, it will still consume energy. Using our transmitters and system all energy is used for positioning, as shown in the graph below, while for GPS transmitters it is about one fifth, about 20 %. In other words: large portion of the weight carried by the animals (i.e. the mass of the transmitter) is unnecessary, because we don’t get any data from it.
For comparison: a GPS transmitter weighing 2 g can provide a maximum of 10 positional data, but cannot transmit it; an ARS transmitter weighing 2 g can provide and transmit 100,000 positional data, which can be remotely accessed in real time.
Manual radio telemetry, i.e. traditional receiver vs ARS
When using a traditional, handheld receiver, we only have data on the animal being observed if someone is currently searching the research area with a receiver. The disadvantage of this human resource intensive solution is that one person can only collect data on one animal at a time, and it takes 50-100 signals and varying amounts of time to estimate the current position of an animal.
THE STRUCTURE OF THE SYSTEM
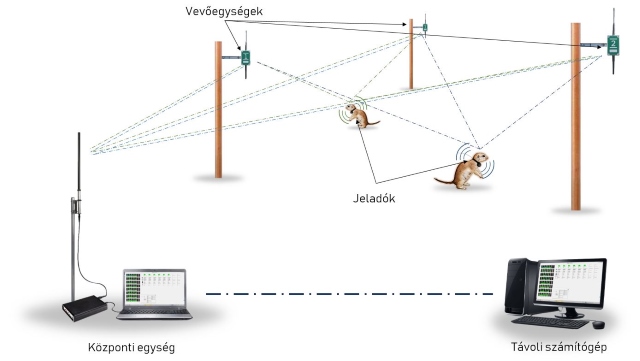
- The test area should be equipped with receivers of small size and weight (less than 1 kg), which can be fixed to a tree or a pole. The receivers can be battery or solar powered, the former requiring battery replacement every 1-2 weeks. The number of receivers to be deployed depends on the terrain conditions.
- The receiver units have to be turned on.
- You need to place the central unit running the data collection software somewhere and switch on the PC/noteboook. It is advisable to place it in a small sheltered room in a nearby building. if this is not possible, a data acquisition and processing unit can be installed next to the receivers, from which the data of the received transmitters can be backed up, preferably weekly, using an SD card.
- The system is operational and picks up signals from animals equipped with transmitters.
Receiver Unit
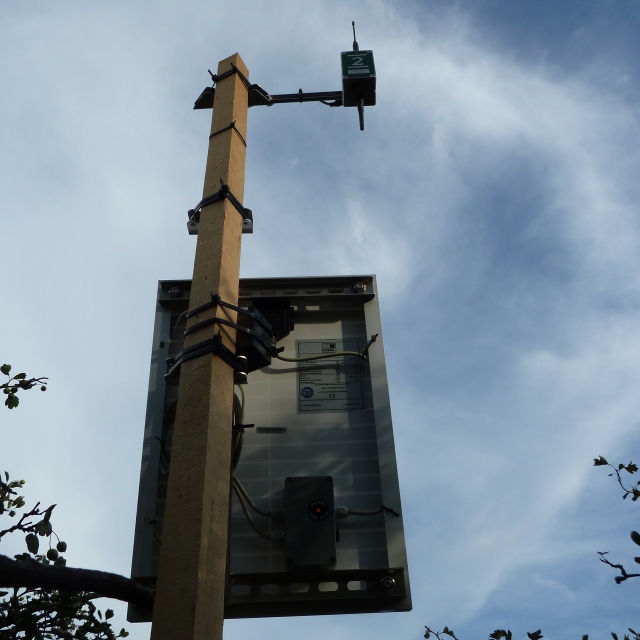
Receives and decodes the signals from the transmitters and sends them to the central unit. There are two types:
- RSSI based: which measures the received signal strength,
- hybrid: Measures the signal strength and also measures the direction of the signal’s origin.
It can be powered in several ways, for example:
- Solar panels,
- Batteries.
Central Unit
It takes the data already processed by the receivers. Stores and displays the received data in a purpose built software. If an internet connection is available, the data stored and processed on the central unit can be accessed from a remote computer.
Can be powered from a solar panel (approx. 200 W), the power grid or battery. The central unit can be placed far away from the observation area (10-20 km), depending on the environment and topography.
Transmitters / Radio Tags

We have developed transmitters for a wide range of animal species such as butterflies, hedgehogs, sowbirds, bats, hornets, martins, falcons, harris hawks, kestrels, eagle owls, bustards, dogs, deer, etc., all of which can be used in the automated data collection system.
The size of the transmitters that can be extremely small, 0.16 g including battery.
They can be programmed according to individual needs to optimise for power consumption, operating time, performance and volume of data.
They can be attached in various ways: by gluing, harnessing, on the leg, hidden in a collar, implanted into body cavities etc.
On the same frequency several transmitters can operate at the same time without interfering with each other’s digital signal transmission.
A wide variety of data can be collected and integrated into the radio signal of the transmitters using different MEMS sensors:
- temperature
- humidity,
- acceleration,
- light,
- magnetic fields etc.
DATA LOGGING, SIGNAL PROCESSING
Data Logging
In the automated system, the process of data collection (logging) and data evaluation and processing are separated. This allows a complex system to be built to meet the needs of the task at hand. As the software allows the simultaneous collection of several different types of data, the above principle allows the storage of different types of data in one file. The native data can be subsequently evaluated in several ways for future research purposes.
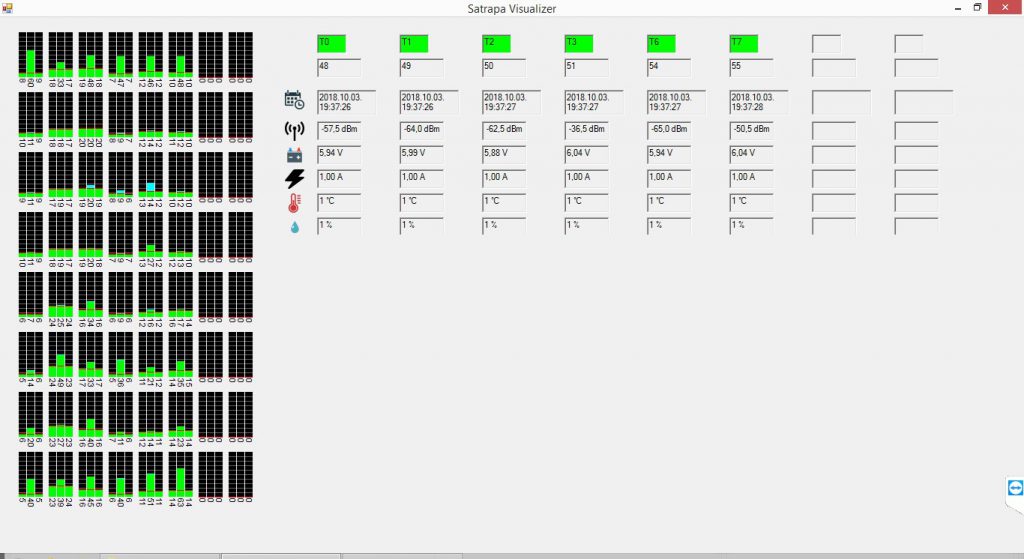
The data logging and processing software displays real-time system status information, signal strengths from the receivers and other measured parameters (temperature, humidity, etc.) as shown in the screen shot below (no prior configuration is required).
Signal Processing
By default, the data can be analysed afterwards, for which we consider MATLAB or Python-based target software to be the best solution, allowing for a sophisticated data analysis. Thanks to our recent developments, we also produce data analysis software that communicates with the data collection software over LAN or WAN networks and displays the processed data in real time, if required.
Position estimation can be based on any of the following 3 methods:
- Based on a physical model,
- based on calibration
- or a combination of the two.
1. The physical model takes into account e.g. the position of the receivers, environmental parameters (vegetation, topography) and is based on the correlation between the geographical position of the transmitters and the strength of the received signal. This method gives less accurate estimates when the environment is complex, i.e. the topography and vegetation of the observation area is varied.
2. The basis of position estimation based on calibration is that, once the system has been installed, the test area is meticulously walked through with a calibrator transmitter and the signals transmitted and received by the receivers are correlated with the current position of the calibrator transmitter (which is recorded by a GPS). If a sufficiently detailed database is created using this method, the location of the source of the signals subsequently received by the receivers from the animal transmitters can be determined using this inverse method (this method is recommended if only RSS based receivers are used).
Below is a calibration map of the observed area at the University of Pannonia (Great tit nesting research by the Institute of Limnology of the University of Pannonia in 2017, research leader: dr. András Liker)
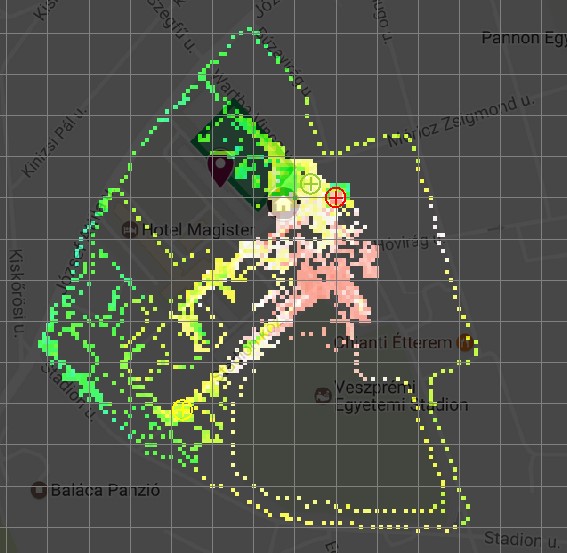
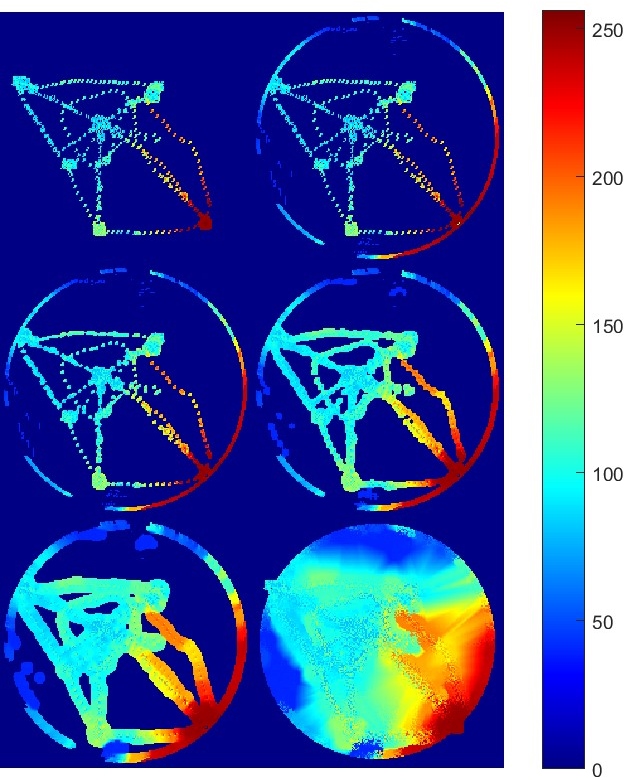
A special intra- and extrapolation procedure is used to generate a calibration map for each measuring tower based on the recorded points, which will be used to determine the location of each transmitter. The figure below shows the steps involved.
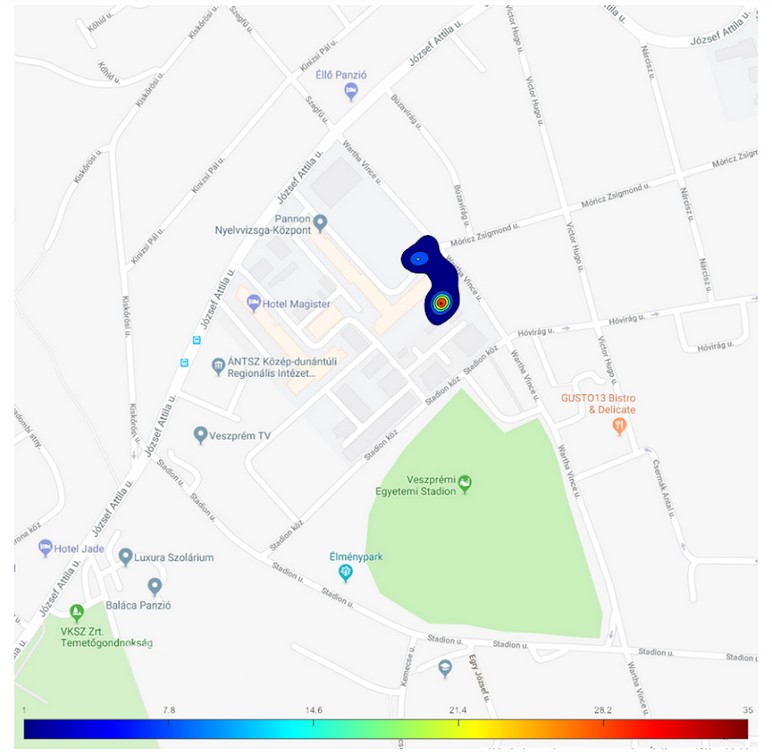
The map below shows the daytime land use of great tits, which is based on a calibration method for position estimation. The different colours show the percentage of occurrence of the tagged species at a given location (research of the Institute of Limnology, University of Veszprém, research leader: Dr. András Liker)
Several observations can already be drawn from the native data of the receivers, as illustrated in the two figures below.
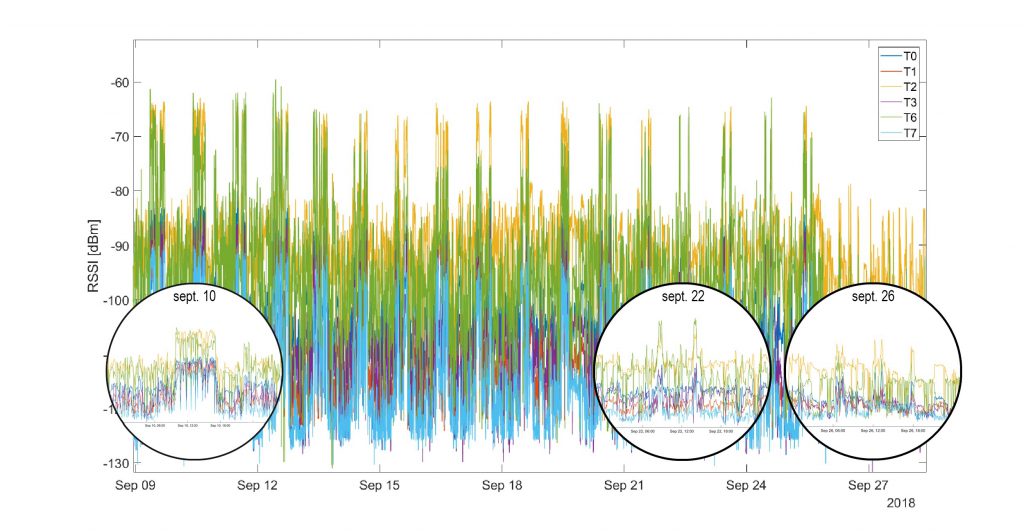
The graph shows that the observed animal was active for a longer period of time during the day on 10 September, but on 22 September it was only active in the morning and late afternoon. (Reintroduction and tracking of spermophilus research project near Kisoroszi, Hungary summer 2018)
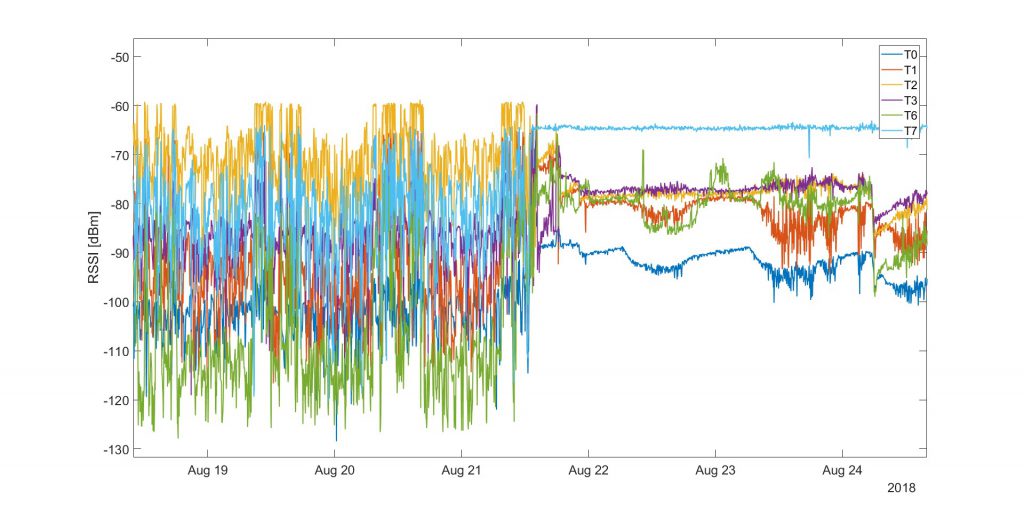
The graph shows the observed mammal mortality on 22 August. (Reintroduction and tracking of spermophilus research project near Kisoroszi, Hungary summer 2018)
It is also possible, for example, to plot the measured positions of the animals on Google Maps, as shown in the figure below.
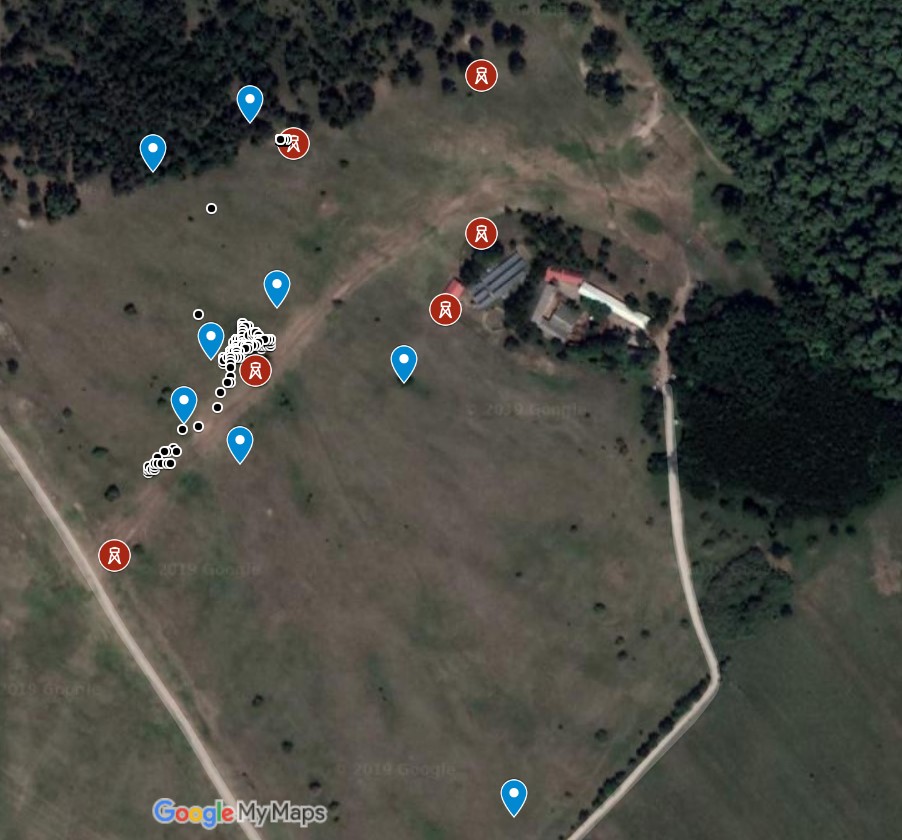
Google map image showing the habitat use of a spermophilus. The black dots indicate the measured positions of the animal, the red dots indicate the deployed receivers, and the blue dots indicate the last measured positions of the other marked animals. Ltd.)
EXAMPLES FOR USING THE SYSTEM
Investigating the behaviour of certain animals to determine movement patterns: thanks to signal densities of up to 1 signal per second, shorter and longer movements and behavioural characteristics of the animals observed can be studied with very high resolution (e.g. characteristics of daily movement rhythms, time shifts, changes in behaviour during the breeding/spawning/laying period, etc.)
The influence of external factors on animal behaviour and movements (e.g. changes in the number of hours of daylight, weather fluctuations, certain agricultural activities, hunting, etc.).
Interactions between animals: for example, if multiple animals are in the same location, if they are approaching other animals or are moving away from each other.
Precise analysis of the crossing of certain well-defined boundaries in time and space. (e.g. plantation boundaries, fences, forest-field boundaries, forest boundaries, boundaries of inhabited areas, etc.)
How animals react when enivronmental parameters are changed.